本帖最后由 BOBO 于 2025-1-21 14:45 编辑
车辆路径规划问题(Vehicle Routing Problem,简称VRP)是运筹学中的一种组合优化问题,主要研究如何在满足一系列约束条件的前提下,规划一组车辆的行驶路线,以实现成本最小化或效率最大化。这个问题在物流、配送等领域具有重要的实际应用价值。常见的VRP及其相关问题有以下几种:
(1)VRP问题:VRP涉及将货物从配送中心送达给客户,同时考虑车辆容量限制、路径长度限制、时间窗口限制等因素,目标是找到一组最短路径来满足所有约束条件。
(2)带时间窗的车辆路径规划问题(VRPTW):在VRP的基础上增加了时间窗的约束,即每个客户有一个特定的时间段可以接受货物。车辆必须在客户的时间窗内到达,否则可能会产生额外的惩罚费用。
(3)带容量限制的车辆路径规划问题(Capacitated VRP,CVRP):这是最基本的VRP变体,考虑每辆车的容量限制、路径约束和装载量约束。
一、模型构建
假设我们有一个配送中心和若干个需求点,每个需求点都有相应的需求量、服务时间以及时间窗约束。我们需要确定一条或多条配送路径,使得总的配送成本最小,同时满足所有的约束条件。
1.参数定义
Ti=[Tistart,Tiend]:需求点I的时间窗
2. 决策变量
xij:车辆是否从需求点i直接前往需求点j的二元变量
yi:需求点i是否被车辆访问
zk:车辆是否使用,二元变量
3.目标函数
目标是最小化车辆的总配送成本,包括运输成本、等待费用、延时费用、货损费用等:
minimiaze
其中,Wi为在需求点i 处的等待时间, Di为在需求点i处的延时时间。
4.约束条件
(1)车辆载重限制

(2)需求点访问约束

每个需求点只能被访问一次。
(3)时间窗约束

%时间窗(小时)(前四个是硬时间窗,后8个是软时间窗)

T=[1.5 10.5;

      1.5 4;

      1.5 10.5;

      1.5 5.5;

      1.5 2;

      1.5 10.5;

      1.5 10.5;

      1.5 4.25;

      1.5 3;

      1.5 6.5;

      1.5 6.5;

      1.5 10.5];
在服务时间窗内到达。
(4)路径连续性约束

保证车辆路径的连续性。
(5)车辆使用约束

通过上述模型的构建,我们可以利用粒子群算法对问题进行求解。在算法中,每个粒子表示一种可能的配送路径,通过不断迭代优化,最终找到总成本最小的路径组合。
二、PSO算法
粒子群优化算法(Particle Swarm Optimization,PSO)是一种基于群体智能的优化算法,它模拟了鸟群觅食行为,通过群体中个体的协作和信息共享来寻找最优解。PSO算法通过在解空间中初始化一群粒子,每个粒子代表一个潜在的最优解,并通过跟踪个体极值(pBest)和群体极值(gBest)来更新粒子的位置和速度,从而实现对最优解的搜索,速度更新公式为:

粒子的位置更新公式为:

三、pso求解VRPTW
(1)粒子群部分代码
% 初始化种群

Particle = zeros(pop, N);

Velocity = zeros(pop, N);

Pbest = zeros(pop, N); % 个体最佳位置

Gbest = zeros(1, N); % 全局最佳位置

Pbest_val = inf(pop, 1); % 个体最佳适应度

Gbest_val = inf; % 全局最佳适应度


for i = 1:pop

      Particle(i, :) = randperm(N, N);

end


hwait = waitbar(0, 'please wait............');

steps = MaxGen;

Jlist = zeros(MaxGen, 1);


% 开始迭代求解

for k = 1:MaxGen

     for s1 = 1:pop

           [val, rou] = objection(Particle(s1, :)); % 计算当前粒子的目标函数值

           J(s1) = val;


        if val < Pbest_val(s1)

             Pbest_val(s1) = val;

             Pbest(s1, :) = Particle(s1, :);

        end


        if val < Gbest_val

            Gbest_val = val;

            Gbest = Particle(s1, :);

        end

    end


    % 更新粒子速度和位置

    for i = 1:pop

         Velocity(i, :) = w * Velocity(i, :) + ...

                c1 * rand(1, N) .* (Pbest(i, :) - Particle(i, :)) + ...

                c2 * rand(1, N) .* (Gbest - Particle(i, :));


        % 将速度应用到粒子位置

        [~, idx] = sort(Velocity(i, :), 'descend');

        Particle(i, :) = idx;

     end


    Jlist(k) = Gbest_val; % 记录当前最优值

    str = [num2str(round((k / steps) * 100)),'%'];

    waitbar(k / steps, hwait, str);

end


% 结果输出

close(hwait);

Result = Gbest;

[result_val, route] = objection(Result);

count_car = 0; % 记录配送中心车辆数


for i = 1:size(route, 1)

      lu = route{i, 1};

      fprintf('车辆%d的配送路径为:', i);

      if length(route{i, 1}) > 0

          count_car = count_car + 1;

          disp(['[' num2str([0 lu 0]) ']'])

      end

end


disp(['最优值是:' num2str(result_val)])


% 画算法收敛图

figure(1)

plot(1:length(Jlist), Jlist, 'r', 'linewidth', 2)

xlabel('迭代次数');

ylabel('每代最优目标函数值');

title('粒子群算法收敛图')


% 画路径图

% Define a color array for different vehicles

colors = ['b', 'g', 'r', 'c', 'm', 'y', 'k']; % You can add more colors if needed
(2)模型部分代码
 for i = 1:size(route, 1)

          lu = route{i, 1};

          for j = 1:length(lu)

                if j == 1

                    total_T(i) = total_T(i) + Do_cum(lu(j)) / avg_v; % 累计一辆车行驶总时间

                    total_d(i) = total_d(i) + Do_cum(lu(j)); % 累计一辆车行驶总距离

                    arrive_T{i, 1}(j) = total_T(i);

                    if total_T(i) < T(lu(j), 1) && lu(j) > Num_t(end)

                        total_T(i) = total_T(i) + T(lu(j), 1) - total_T(i); % 累计一辆车行驶总时间

                        wait_T(i) = wait_T(i) + T(lu(j), 1) - total_T(i); % 累计一辆车等待时间

                    else

                          if lu(j) <= Num_t(end) && total_T(i) < T(lu(j), 1)

                              val = 1e5;

                              return;

                          end

                    end

                    if total_T(i) > T(lu(j), 2) && lu(j) > Num_t(end)

                        delay_T(i) = total_T(i) - T(lu(j), 1); % 累计一辆车延时时间

                    else

                           if lu(j) <= Num_t(end) && total_T(i) > T(lu(j), 2)

                               val = 1e5;

                               return;

                            end

                   end

                   total_T(i) = total_T(i) + SeverT(lu(j)); % 加上服务时间

             else

                   total_T(i) = total_T(i) + D_cum(lu(j - 1), lu(j)) / avg_v; % 累计一辆车行驶总时间

                   total_d(i) = total_d(i) + D_cum(lu(j - 1), lu(j)); % 累计一辆车行驶总距离

                   arrive_T{i, 1}(j) = total_T(i); % 计算一辆车到达各点的时间

                   if total_T(i) < T(lu(j), 1) && lu(j) > Num_t(end)

                        total_T(i) = total_T(i) + T(lu(j), 1) - total_T(i); % 累计一辆车行驶总时间

                        wait_T(i) = wait_T(i) + T(lu(j), 1) - total_T(i); % 累计一辆车等待时间

                  else

                       if lu(j) <= Num_t(end) && total_T(i) < T(lu(j), 1)

                           val = 1e5;

                           return;

                       end

                  end

                  if total_T(i) > T(lu(j), 2) && lu(j) > Num_t(end)

                      delay_T(i) = total_T(i) - T(lu(j), 1); % 累计一辆车延时时间

                  else

                       if lu(j) <= Num_t(end) && total_T(i) > T(lu(j), 2)

                            val = 1e5;

                            return;

                       end

                end

         end

  end

  f_yushu(i) = C2 * total_d(i); % 一辆车运输成本

  total_fee(i) = f_yushu(i) + C1 + M2 * delay_T(i) + M1 * wait_T(i) + ...

        (C3 * H1 + C4 * xigma1) * total_d(i) / avg_v + (C3 * H2 + C4 * xigma2) * sum(SeverT(lu)); % 一辆车总成本

    end


    val = sum(total_fee); % 所有的总成本
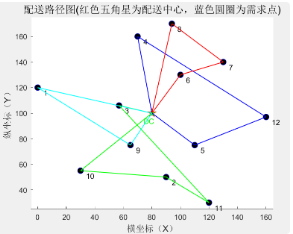
四、运行结果

车辆1的配送路径为:[0  11   7  12   0]

车辆2的配送路径为:[0  10   3   4   0]

车辆3的配送路径为:[0  5  8  6  1  0]

车辆4的配送路径为:[0  9  2  0]

最优值是:1142.9607
本文转载自微信公众号:群智能算法小狂人
|